Psychological Research
Correlational Research
Correlation means that there is a relationship between two or more variables (such as ice cream consumption and crime), but this relationship does not necessarily imply a cause-and-effect relationship. When two variables are correlated, it means that as one variable changes, the other changes in response. We can measure correlation by calculating a statistic known as a correlation coefficient. A correlation coefficient is a number from -1 to +1 that indicates the strength and direction of the relationship between variables. The letter r usually represents the correlation coefficient.
The number portion of the correlation coefficient indicates the strength of the relationship. The closer the number is to 1 (whether positive or negative), the stronger the relationship between the variables, and the more predictable changes in one variable will be as the other variable changes. The closer the number is to zero, the weaker the relationship and the less predictable it becomes between the variables. For instance, a correlation coefficient of 0.9 indicates a far stronger relationship than a correlation coefficient of 0.3. If the variables are not related to one another at all, the correlation coefficient is 0. The example above about ice cream and crime is an example of two variables that we might expect to have no relationship to each other.
The sign—positive or negative—of the correlation coefficient indicates the direction of the relationship (Figure 1). A positive correlation means that the variables move in the same direction. Put another way, it means that as one variable increases, the other also increases, and conversely, when one variable decreases, the other decreases. A negative correlation means that the variables move in opposite directions. If two variables are negatively correlated, a decrease in one variable is associated with an increase in the other and vice versa.
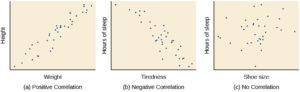
Figure 1. Scatterplots are a graphical view of the strength and direction of correlations. The stronger the correlation, the closer the data points are to a straight line. In these examples, we see that there is (a) a positive correlation between weight and height, (b) a negative correlation between tiredness and hours of sleep, and (c) no correlation between shoe size and hours of sleep.
The example of ice cream and crime rates illustrates a positive correlation because both variables tend to increase when temperatures are warmer. Other examples of positive correlations include the relationship between an individual’s height and weight, and the relationship between a person’s age and the number of wrinkles. One might expect a negative correlation to exist between someone’s tiredness during the day and the number of hours they slept the previous night: the amount of sleep decreases as the feelings of tiredness increase. In a real-world example of negative correlation, student researchers at the University of Minnesota found a weak negative correlation (r = -0.29) between the average number of days per week that students got fewer than 5 hours of sleep and their GPA (Lowry, Dean, & Manders, 2010). Keep in mind that a negative correlation is not the same as no correlation. For example, we would probably find no correlation between hours of sleep and shoe size.
Video 1. Correlational Research Design provides explanation and examples for correlational research. A closed-captioned version of this video is available here.
Exercises
Manipulate this interactive scatterplot to practice your understanding of positive and negative correlations.
As mentioned earlier, correlations have predictive value. Imagine that you are on the admissions committee of a major university. You are faced with a massive number of applications, but you can only accommodate a small percentage of the applicant pool. How might you decide who should be admitted? You might try correlating your current students’ college GPAs with their scores on standardized tests, such as the SAT or ACT. By observing which correlations were strongest for your current students, you could use this information to predict the relative success of those students who have applied for admission into the university.
Correlation Does Not Indicate Causation
Correlational research is useful because it allows us to discover the strength and direction of relationships that exist between two variables. However, correlation is limited because establishing the existence of a relationship tells us little about cause and effect. While variables are sometimes correlated because one causes the other, it is also possible that some other factor, a confounding variable, is actually causing the systematic movement in our variables of interest. In the ice cream/crime rate example mentioned earlier, temperature is a confounding variable that could account for the relationship between the two variables.
Even when we cannot identify clear confounding variables, we should not assume that a correlation between two variables implies that one variable causes changes in the other. This can be frustrating when a cause-and-effect relationship seems clear and intuitive. Think back to our discussion of the research done by the American Cancer Society and how their research projects were some of the first demonstrations of the link between smoking and cancer. It seems reasonable to assume that smoking causes cancer, but if we were limited to correlational research, we would be overstepping our bounds by making this assumption.
Unfortunately, people often mistakenly claim causation based on correlations. Such claims are especially common in advertisements and news stories. For example, recent research has found that people who eat cereal on a regular basis tend to achieve healthier weights than those who rarely eat cereal (Frantzen, Treviño, Echon, Garcia-Dominic, & DiMarco, 2013; Barton et al., 2005). Guess how the cereal companies report this finding. Does eating cereal really cause an individual to maintain a healthy weight, or are there other possible explanations, such as someone at a healthy weight is more likely to regularly eat a healthy breakfast than someone who is obese or someone who avoids meals in an attempt to diet? While correlational research is invaluable in identifying relationships among variables, a significant limitation is the inability to establish causality. Psychologists want to make statements about cause and effect, but the only way to do that is to conduct an experiment to answer a research question. The next section describes how scientific experiments incorporate methods that eliminate or control for alternative explanations, enabling researchers to investigate how changes in one variable lead to changes in another variable.
Video 2. Correlation and Causality provides an explanation for why correlation does not imply causality.
Illusory Correlations
The temptation to make erroneous cause-and-effect statements based on correlational research is not the only way we tend to misinterpret data. We also tend to make the mistake of illusory correlations, especially with unsystematic observations. Illusory correlations, or false correlations, occur when people believe that relationships exist between two things when no such relationship exists. One well-known illusory correlation is the supposed effect that the moon’s phases have on human behavior. Many people passionately assert that the phase of the moon influences human behavior, and specifically, that people exhibit unusual behavior when the moon is full (Figure 2).

There is no denying that the moon exerts a powerful influence on our planet. The ebb and flow of the ocean’s tides are tightly tied to the gravitational forces of the moon. Many people believe, therefore, that it is logical that we are affected by the moon as well. After all, our bodies are mainly composed of water. A meta-analysis of nearly 40 studies consistently demonstrated, however, that the relationship between the moon and our behavior does not exist (Rotton & Kelly, 1985). While we may pay more attention to odd behavior during the full phase of the moon, the rates of odd behavior remain constant throughout the lunar cycle. Why are we so apt to believe in illusory correlations like this? Often, we read or hear about them and simply accept the information as valid. Alternatively, we may have a hunch about how something works and then look for evidence to support that hunch, ignoring evidence that would suggest our hunch is false; this is known as confirmation bias. At other times, we find illusory correlations based on the information that comes most readily to mind, even if that information is severely limited. And while we may feel confident that we can use these relationships to better understand and predict the world around us, illusory correlations can have significant drawbacks. For example, research suggests that illusory correlations—in which certain behaviors are inaccurately attributed to certain groups—are involved in the formation of prejudicial attitudes that can ultimately lead to discriminatory behavior (Fiedler, 2004).
